Quick Response Manufacturing (QRM) is a companywide strategy to cut lead times in all phases of manufacturing and office operations. It can bring your products to the market more quickly and help you compete in a rapidly changing manufacturing arena. It will increase profitability by reducing cost, enhance delivery performance and improve quality.
QRM’s overarching focus on time as the guiding management strategy is ideally suited for companies offering high-mix, low-volume and custom-engineered products. In fact, many companies making highly customized products and/or a high variability in their product mix have used QRM as an addition to existing Lean, Six Sigma, and other improvement efforts.
The following Tech Talk provides an excellent introduction to the core principles of Quick Response Manufacturing:
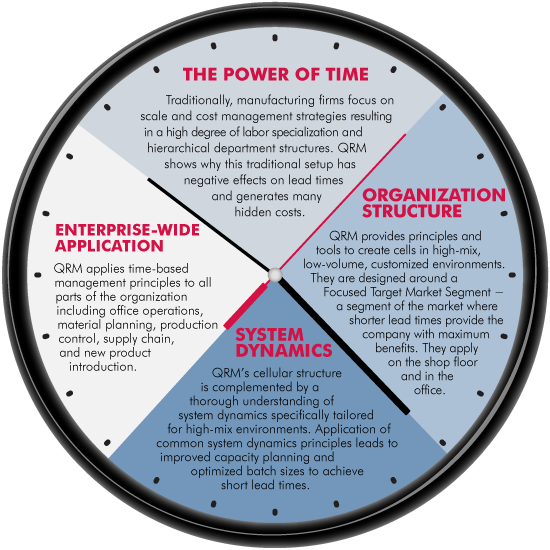
Time is the most valuable resource in an enterprise
Long lead times come with many hidden costs – much more than most managers realize. For over 25 years, QRM has helped companies of all sizes and industries uncover the causes for long lead times and provided tools to eliminate them.
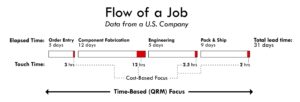
In fact, research has consistently shown that, in most manufacturing companies, the amount of time a product is actually worked on accounts for less than 5% of the total lead time. The rest is spent waiting (check lead time graph from an actual company below).
 QRM provides a full set of tools to reduce unnecessary lead time in all areas of your operations – from shop floor, to office operations, accounting, engineering and new product launches. This will, in turn, allow your organization to gain a competitive advantage in the global market, as well as provide you with a better opportunity to compete with low-wage countries.
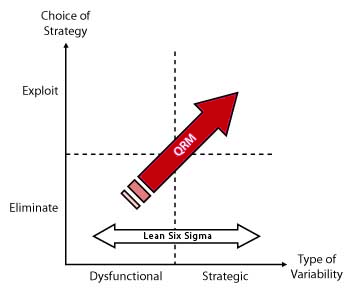
Lean and Six Sigma approaches provide many tools to identify and eliminate variability in operations and create better flow. These approaches have been shown to work well in high-volume production environments. In contrast, high-mix, low-volume and customization environments pose significant challenges due to the presence of two different types of variability.
- Dysfunctional variability: Errors, ineffective systems and poor organization that cause rework, constantly changing priorities and “lumpy” demand.
- Strategic variability: This form of variability is introduced to enterprises in order to compete in the market. The ability to cope with unexpected changes in demand, a large selection of options for customers and offering custom-engineered products are all examples for strategic variability.
The core Lean and Six Sigma techniques aim to eliminate all variability in the manufacturing system. These techniques are effective as far as dysfunctional variability is concerned but ineffective when it comes to strategic variability, especially if it is part of the company’s competitive advantage.
Like Lean, QRM encourages companies to get rid of dysfunctional variability. However, QRM does not eliminate strategic variability, instead it exploits it. QRM organizations are designed to effectively cope with this variability and thrive in the high-customization markets of the future.
QRM and Lean
QRM enables organizations to exploit strategic variability and compete in markets requiring high levels of customization. Building on Lean’s focus on dysfunctional variability, it takes the strategy to the next level.
| Commodity | MCT (in days) | % MCT Reduction | % On-time Delivery | As-delivered PPM | % Cost Reduction | |||||||||||
|---|---|---|---|---|---|---|---|---|---|---|---|---|---|---|---|---|
| Before | After | Before | After | Before | After | |||||||||||
| Blades | 15 | 2 | 87 | 74 | 97 | 4,500 | 300 | 11 | ||||||||
| Knives | 104 | 15 | 86 | 40 | 88 | 12,000 | 1,500 | 22 | ||||||||
| Hydraulic Valves | 141 | 10 | 93 | 40 | 98 | 50,000 | 1,500 | 14 | ||||||||
| Hydraulic Motors | 42 | 18 | 57 | 40 | 97 | 15,000 | 500 | 20 | ||||||||
| Wiring Harnesses | 32 | 2 | 94 | 43 | 99 | 3,000 | 500 | 20 | ||||||||
| Seat Assemblies | 25 | 5 | 80 | 40 | 95 | 50,000 | 500 | 16 | ||||||||
| Machined Parts | 22 | 10 | 56 | 99 | 99 | 300 | 300 | 12 | ||||||||
| Circuit Boards | 25 | 16 | 36 | 99 | 100 | 3,164 | 14 | 17 | ||||||||
|
Ericksen, Paul; Suri, Rajan (2001). “Managing the Extended Enterprise”. Purchasing Today 12 (2).
MCT = Manufacturing Time Cycle PPM = Quality in Part Per Million Defects |
||||||||||||||||

